The ten numbers worth tracking on a game server are: players online and peak, unique players, new vs returning players, D1/D7/D30 retention, session length, churn, performance (TPS, server FPS or frame time), uptime, ping and packet loss, and revenue (net, ARPPU and conversion). The first three tell you how busy you are, the next three whether players stay, the next three whether the server is good to play on, and the last whether it pays for itself.
For each one below: what it is, why it matters, how to get it for free, and how ServerStats shows it.
1. Players online and peak players
What: concurrent players right now, and the peak over a day or week.
Why: the number every player sees in the server browser. Empty servers stay empty; a busy one attracts more. The peak tells you when to run events and when not to restart.
Free: any query tool. Steam games answer A2S, Minecraft answers Server List Ping. BattleMetrics shows public history for many games.
ServerStats: players online on every server's Overview, on every plan, including basic mode with nothing installed.
2. Unique players (DAU and MAU)
What: distinct players per day and per month. Their ratio, DAU/MAU, is a rough stickiness measure: 30% means the average monthly player shows up about nine days a month.
Why: peaks can hide a shrinking community of long sessions, or a growing one of short visits.
Free: count distinct IDs in your join logs per day.
ServerStats: unique players in the weekly report with the change on the week before, and joins and unique players per server in the All servers view (Network).
3. New vs returning players
What: first-time players vs players you have seen before.
Why: a server with flat numbers can be replacing its community every week. New players measure your reach; returning players measure your pull.
Free: a first-seen table from your logs.
ServerStats: the weekly report lists new players and the change on the week before; new and returning counts are visible in the dashboard and available through MCP on Network. The weekly cohort table shows what happened to each week's new players.
4. D1, D7 and D30 retention
What: the share of new players who come back 1, 7 and 30 days after their first session, measured per weekly cohort.
Why: the clearest measure of whether your first impression and your content work. See D1, D7 and D30 explained.
Free: a spreadsheet over your join logs, or Plan on Minecraft.
ServerStats: weekly retention cohorts with D1/D7/D30 and W1 to W7 on Operator and up.
5. Session length
What: how long a visit lasts from join to leave. Use the median; a few AFK players ruin the average.
Why: short sessions from new players mean they bounce at spawn. Falling session length among regulars often comes before churn.
Free: pair join and quit lines in your logs.
ServerStats: sessions per player on the Players page and profiles; average and median session length are also available through MCP on Network. The built-in Ask ServerStats assistant is coming soon.
6. Churn and churn risk
What: regulars who stop playing. More useful than a monthly churn rate is spotting players drifting away from their usual rhythm now.
Why: a regular is worth more than a new player, and much cheaper to keep than to replace.
Free: compare each regular's time since last seen with their usual gap between sessions.
ServerStats: a 0 to 100 churn-risk score per regular with the reasons, a Players at risk list and a churn_risk alert, on Operator and up. See spotting players about to leave.
7. Server performance
What: the engine's own health number. Minecraft and Hytale: TPS and MSPT (20 TPS means a 50 ms budget per tick). Rust: server FPS. FiveM: server frame time and resource time. Source games: tick rate. Plus lag spikes: single ticks or frames far over budget.
Why: lag is the most common reason players give for leaving, and averages hide it: 19.9 TPS with a two-second freeze every ten minutes feels awful.
Free: /tps and spark on Paper, serverinfo over RCON on Rust (FPS and entity count), resmon on a FiveM client, stats in a Source server console.
ServerStats: the engine page for each game, with lag spikes attributed to a plugin, resource or engine phase where the game allows it. Guides: Minecraft, Rust, FiveM.
8. Uptime
What: the share of time the server is reachable. See uptime.
Why: players who find you offline try another server, and some do not come back. 99.5% sounds high but allows about 3.6 hours down a month; when those hours fall matters as much as how many there are.
Free: poll your query port every minute from another machine and log failures, or use a free uptime monitor with a TCP or UDP check.
ServerStats: uptime from agent heartbeats or basic-mode polling, a server_down alert on every plan, and uptime in the weekly report.
9. Ping and packet loss
What: round-trip time per player (ping) and dropped packets (packet loss).
Why: high ping for most players means the server is in the wrong region for your audience. Loss spikes point to the host's network or a DDoS.
Free: the scoreboard or status command; mtr from a player's machine to your server for loss by hop.
ServerStats: per-player ping on agents that expose it (Minecraft, Rust, Source games and others). Packet loss only where the engine reports it, for example Counter-Strike: Source.
10. Revenue, ARPPU and conversion
What: net revenue (after refunds and chargebacks), ARPPU (net per paying player), ARPU (per active player) and conversion (share of players who ever buy).
Why: hosting, staff and development cost money. Net revenue tells you if you cover it; ARPPU and conversion tell you whether to find more buyers or offer existing ones more.
Free: your store's statistics page (Tebex, PayNow, CraftingStore).
ServerStats: Tebex, PayNow and CraftingStore webhooks matched to players, with packages, creator codes, revenue per player-hour and lifetime value by source, on Operator and up. See tracking Tebex revenue.
Putting it on one screen
Checking ten tools every morning does not last. Pick three to look at daily (players online, performance, uptime) and review the rest weekly.
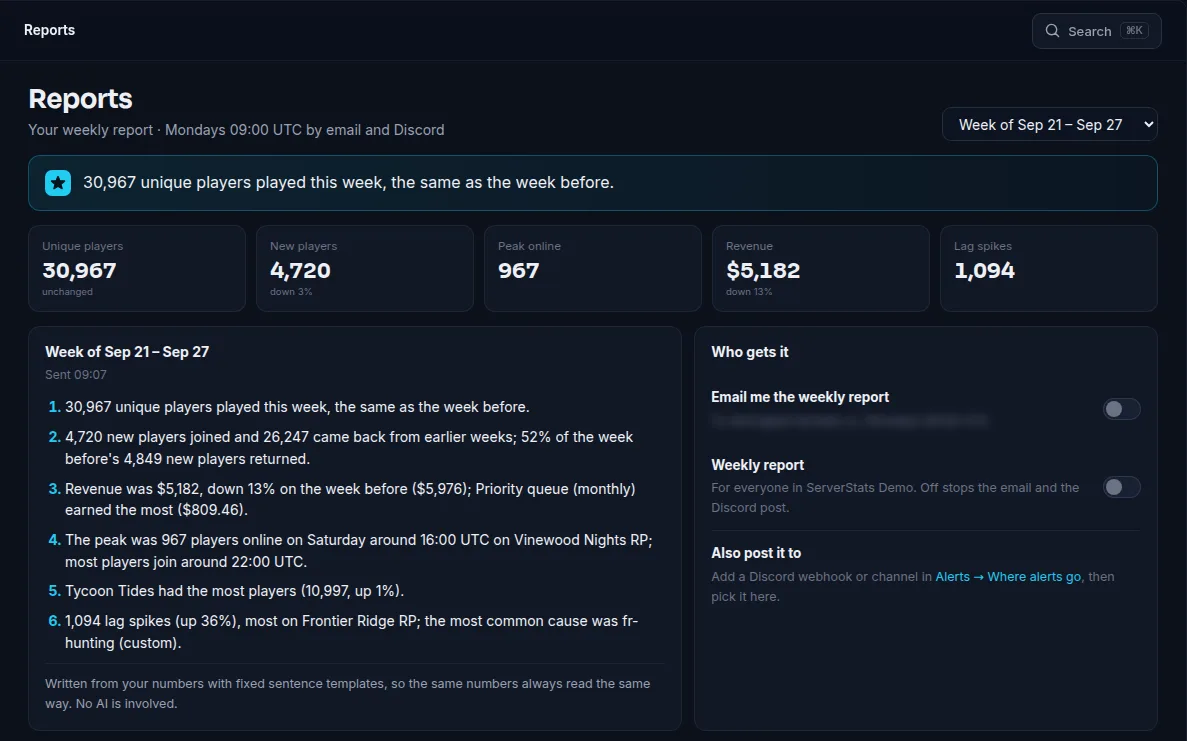
The ServerStats weekly report (Operator and up, by email; Network adds a webhook) does the weekly review for you: unique players, new players, peak online, revenue, lag spikes and (where measured) uptime, with the change on the week before, plus a few sentences on what changed: returning players, the busiest hour, the top package and the main lag cause.
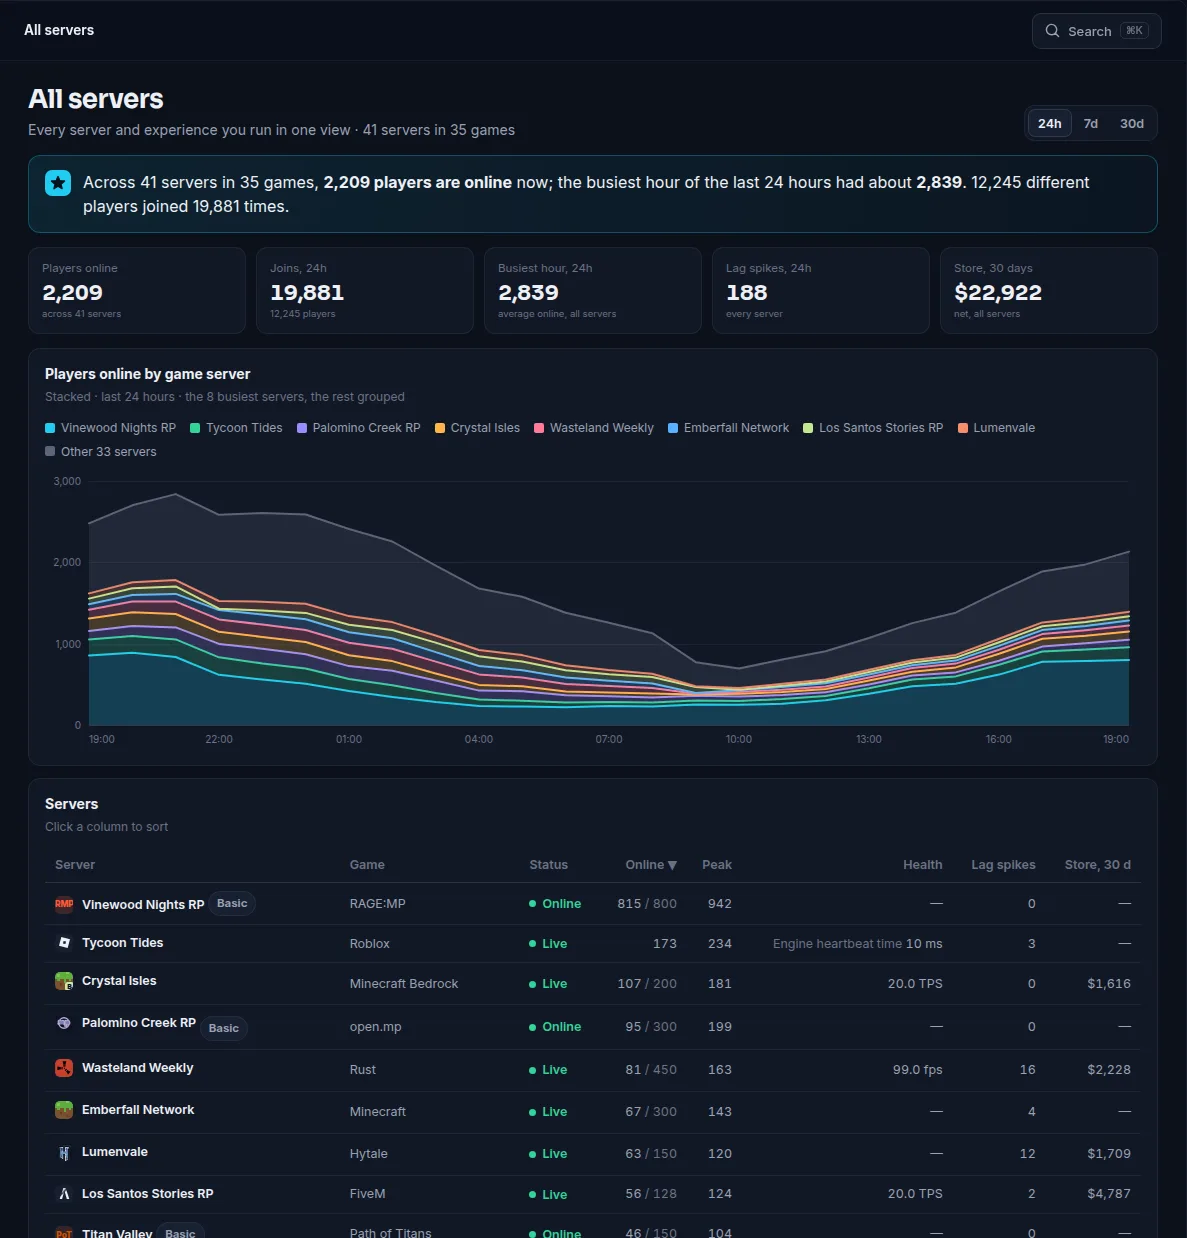
If you run several servers, the All servers view on Network puts every server and game side by side: players online, peaks, joins, lag spikes and store revenue.
Summary
- Busy: players online and peak, unique players, new vs returning.
- Sticky: D1/D7/D30 retention, session length, churn.
- Playable: TPS, FPS or frame time with lag spikes; uptime; ping and loss.
- Sustainable: net revenue, ARPPU and conversion.
- Most can be measured for free with queries, console commands and logs. ServerStats puts them in one place and reports weekly.