A Rust server's FPS is how many times per second the server runs its main loop and simulates the world: physics, AI, building decay, player input and every plugin hook. It has nothing to do with the frame rate players see on their own screens. Healthy servers hold well above 30 FPS; sustained drops toward 20 and below are where players start to feel desync, and the usual causes are too many entities late in a wipe, expensive plugin hooks, world saves and garbage collection.
Server FPS vs client FPS
- Client FPS is how fast a player's PC renders frames. It depends on their GPU and settings.
- Server FPS is how many simulation frames the dedicated server completes per second. Each frame, the server moves NPCs and vehicles, runs physics, processes player packets, runs building decay and calls plugin hooks.
The inverse of FPS is frame time: at 60 FPS each frame takes about 16.7 ms, at 30 FPS about 33 ms, at 10 FPS 100 ms. A single long frame (a lag spike) is felt as a freeze, even if the per-second average still looks fine.
The server's frame rate is capped by fps.limit. Type it in the server console to see your current cap. Running uncapped does not make the game feel better for players past a point, and it burns CPU that other servers on the same host could use, so many hosts cap it.
Note: server.tickrate is a different setting. It controls how often the server sends network updates to clients, not how often it simulates the world.
How to check your Rust server's FPS
From the server console or RCON:
server.fps     current server frame rate
serverinfo     JSON with Framerate, EntityCount, players, memory, uptime and more
fps.limit      the current frame cap
serverinfo over RCON is what most panels and RCON tools poll. It's the fastest way to see FPS and entity count side by side.
For plugins, both frameworks keep a running total of time spent in each plugin's hooks:
- Oxide/uMod:
o.pluginslists every plugin with its total hook time in seconds. - Carbon:
c.pluginslists plugins with their hook time, and Carbon also ships its own profiler.
Take two readings a few minutes apart and compare. A plugin whose hook time grows fast while FPS is low is your first suspect.
What healthy looks like
There is no official Facepunch target, so treat these as experience-based rules of thumb:
| Server FPS | Frame time | What players notice |
|---|---|---|
| 60+ | under 17 ms | Nothing. Plenty of headroom |
| 30–60 | 17–33 ms | Usually fine |
| 20–30 | 33–50 ms | Occasional desync in busy fights and raids |
| under 20 | over 50 ms | Rubber-banding, delayed hits, doors and elevators lagging |
Look at the dips, not only the average. A server that averages 60 but drops to 5 for two seconds during every save feels worse than one that sits at a steady 40.
What drags Rust server FPS down
Entity count, and the wipe cycle
Every placed building block, deployable, box, sleeping bag, dropped item, NPC and vehicle is an entity. Entity count starts low on wipe day and climbs all wipe as bases grow. That is why FPS on the same hardware is great on day one and poor by day 20. Map size compounds it: a bigger map leaves room for more bases and more monuments with NPCs.
Things that keep entity count in check:
- Normal building decay, and not making it too generous.
- Wiping on a schedule that matches your player base. Rust's forced monthly wipe resets the map anyway; many servers also wipe weekly or bi-weekly.
- Watching for abandoned bases and item spam around popular spots.
- Plugin limits on deployables per player, if your server needs them.
Plugin hooks
Oxide and Carbon plugins run inside the server's frame. A plugin that does heavy work in a hot hook (OnEntitySpawned, OnEntityTakeDamage, OnTick, OnPlayerInput) or loops over every entity on a timer adds its cost to every frame. Admin-tool plugins that scan all entities, and anything that writes big data files synchronously, are common offenders.
World saves
Rust saves the world every server.saveinterval seconds. The save blocks the main thread for a moment, and the moment grows with entity count. A regular, predictable dip every save interval is the signature. The console prints a Saved N ents line with timings after each save.
Garbage collection
Rust runs on Unity's Mono runtime. As plugins and the game allocate memory, the garbage collector has to run, and a big collection can stall a frame. Frequent GC spikes with no save running and no plugin standing out often point to a plugin allocating heavily every frame. gc.collect forces a collection, which itself causes a stall, so don't put it on a short timer.
Hardware and host contention
Rust's main simulation is largely single-threaded, so single-core clock speed matters more than core count. On shared hosts, a noisy neighbour can drop your FPS without anything changing on your server. If FPS drops while entity count, plugins and saves look normal, check the host's CPU.
How ServerStats tracks Rust server FPS
The ServerStats Rust agent is one C# plugin that loads unchanged under Carbon and Oxide. It measures every frame on the server and sends:
- Server FPS and a per-frame time histogram, plus counts of frames over spike thresholds.
- Entity count, managed memory, allocations and GC collections.
- Save duration when Rust's
Saved N entscompletion line arrives with a usable start time or nonzero logged timing. - Per-plugin hook time for every loaded plugin, as a running series.
- Process and host CPU and memory, so you can tell your server from a noisy neighbour.
- Wipe detection: every map wipe is marked, and wipe age is tracked, so you can compare FPS on day 1 against day 20. See wipe-day analytics.
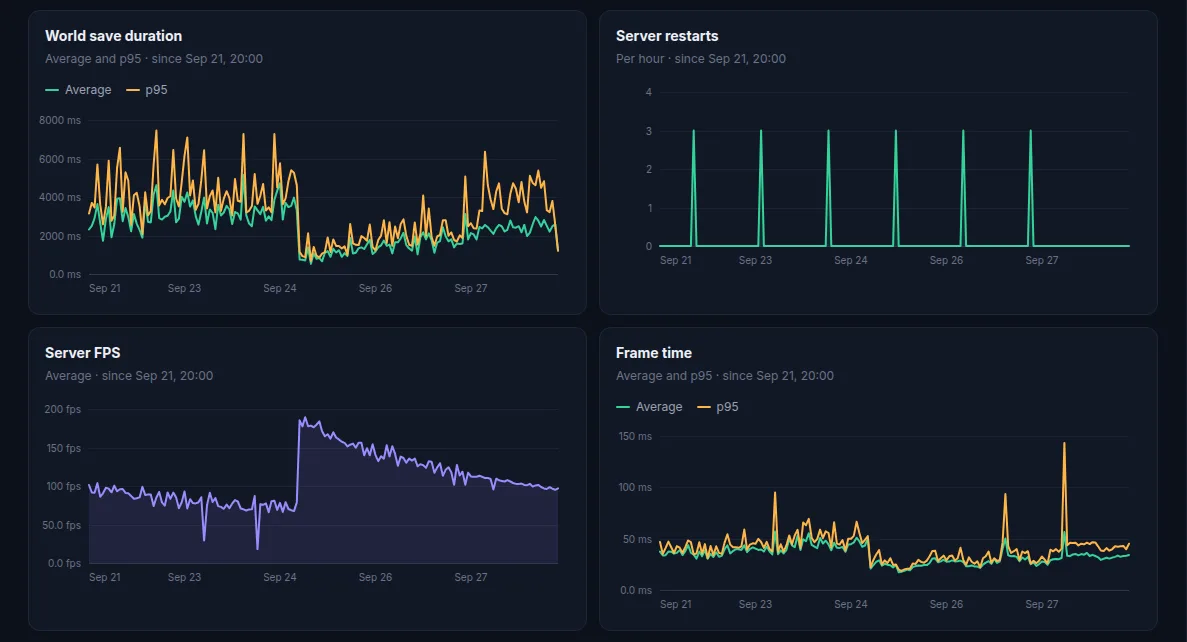
Investigating long frames with plugin hook timing
For each frame, the agent reads every plugin's cumulative hook time (Oxide's TotalHookTime, and Carbon's equivalent). When a frame reaches the lag spike threshold (250 ms by default, "Lag spike (ms)" in the config), it shows the plugin hook time measured during that frame. It also records whether a save or garbage collection was in progress. A large hook time is a useful lead; save and GC flags show overlap, not proven cause. The unmeasured remainder of a frame cannot be assigned reliably to one component.
Each spike event carries the frame time, the top three measured hook times or frame categories with their share, plugin time, players and entity count. At most one is sent every 10 seconds, with a count of the spikes merged into it. On the agent's test servers, a 400 ms busy loop in a test plugin accounted for 99.5% of one long frame on Carbon, and 350 of 351 ms on Oxide.
The limits are worth knowing: this is hook time, so work a plugin does on its own threads or in Unity coroutines isn't attributed to it, and on Carbon, plugin timers aren't included in the hook-time counter.
The agent's own cost on the main thread measured 0.3 to 0.6 µs per frame on the test server, and serverstats.status in the console shows it live. It needs no RCON access and opens no ports. You can get a Discord alert on lag spikes on every plan. Installing takes a few minutes: see installing on Carbon and Oxide.
A quick checklist
- Run
serverinfo: note FPS and entity count, and compare with the same point last wipe. - Is the dip regular? Line it up with the save interval.
- Compare plugin hook times a few minutes apart with
o.pluginsorc.plugins. - Low FPS on a fresh wipe? Look at plugins, map size and the host, not entities.
- Keep FPS, entities and saves recorded across the whole wipe so the slow decline is visible before players complain.
 Rust