To find which plugin is lagging a Paper server, run spark's profiler only on slow ticks (/spark profiler start --only-ticks-over 100) and look at which plugin's code fills the main thread in those ticks. Watch MSPT (milliseconds per tick), not TPS: TPS is capped at 20 and only drops once every tick is already over budget, while MSPT shows how close you are to lagging before players notice.
This guide explains the two numbers, how to read spark, what usually causes lag, and how to catch the spike that happens at 3 a.m. when nobody is running a profiler.
TPS vs MSPT: the 50 ms budget
A Minecraft server runs its game loop 20 times a second. That gives each tick a budget of 50 ms (1000 ms / 20). In that time the main thread moves every entity, ticks redstone and hoppers, loads and saves chunks, handles player packets and runs every plugin's event handlers and scheduled tasks.
- TPS (ticks per second) is how many ticks actually completed in a second. The server never runs faster than 20, so a healthy server shows 20.0 whether its ticks take 2 ms or 49 ms.
- MSPT (milliseconds per tick) is how long each tick took. When MSPT goes above 50, the server can't keep up and TPS falls below 20: at 100 ms per tick you get about 10 TPS, and everything in the world runs at half speed.
That is why MSPT is the better signal. A server at 20 TPS and 12 ms MSPT has plenty of room. A server at 20 TPS and 47 ms MSPT is about to lag, and TPS gives you no warning at all. MSPT also shows short spikes: a single 600 ms tick once a minute barely moves the 1-minute TPS average, but every player feels it as a rubber-band.
| MSPT (average) | What it means |
|---|---|
| under 25 ms | Comfortable. Room for events, farms and join rushes |
| 25–40 ms | Fine today, watch the trend as the map and player count grow |
| 40–50 ms | No headroom. Any spike drops TPS |
| over 50 ms | TPS is below 20; the world is running slow |
On Paper, /tps shows the 1, 5 and 15-minute averages and /mspt shows average, min and max tick time over the last 5 seconds, 10 seconds and 1 minute. Always look at the max as well as the average.
Measure it with spark
Paper bundles spark from 1.21 onwards, so on a current Paper or Purpur server you already have it. The useful commands:
/spark tps                                   TPS and tick durations (min/median/95th/max) plus CPU
/spark health                                a live health report: TPS, MSPT, CPU, memory, disk, GC
/spark profiler start --timeout 300          sample everything for 5 minutes, then upload the report
/spark profiler start --only-ticks-over 100  only record ticks slower than 100 ms
/spark profiler stop                         stop early and get the viewer link
/spark gc                                    garbage collector history
/spark tickmonitor                           print a line whenever a tick runs long
For a lag hunt, --only-ticks-over is the one that matters. A normal profile averages your good ticks with your bad ones, and the cause of a spike disappears into the noise. Filtering to slow ticks means the report shows only what the main thread was doing when it lagged.
Reading the profile
Open the viewer link and expand the Server thread. spark shows a call tree with the share of time spent under each node. Work down from the top:
- Expand the tick until you see the big branches: entity ticking, block entity (tile entity) ticking, chunk loading, the scheduler and event dispatch.
- Plugin code appears under the scheduler (
CraftScheduler) for tasks and under event dispatch for listeners. The package name tells you whose code it is (com.example.shops...). In the viewer's sidebar you can also switch to a per-plugin breakdown. - Anything that isn't plugin code is the server itself: too many entities, a hopper chain, chunk generation. Those need a world fix, not a plugin fix.
spark's percentages are shares of the sampled time. If a plugin shows 40% of the slow ticks, removing or fixing it takes 40% off those ticks.
Note: Paper deprecated Timings, turned it off by default in 1.21 and has since removed it. Old forum advice to "post your timings" now means "post a spark link".
Common causes of Minecraft server lag
In rough order of how often they show up in real profiles:
- Entities. Mob farms, item piles, villager halls and animal pens. Each entity ticks every tick.
/spark profilershows entity ticking as its own branch; Paper's world config (config/paper-world-defaults.yml) has per-type spawn limits, despawn ranges and per-chunk entity save limits. Count entities per world before you blame a plugin. - Redstone and hoppers. Large hopper chains and clocks tick constantly. They show up as block entity ticking. Paper's hopper options (such as
hopper.disable-move-event) and a hopper-limit plugin help. - Chunk loading and generation. Players flying with elytra into new terrain force world generation on demand. Pre-generate the world (a plugin such as Chunky does this), set a world border, and lower view distance or simulation distance if needed.
- Plugins doing blocking I/O on the main thread. The classic: a plugin that runs a MySQL query, writes a file or calls a web API synchronously in an event handler or a sync task. It's fast on a quiet test server and freezes the tick when the database is slow. In spark it looks like a plugin frame with socket or JDBC calls underneath.
- Plugins scanning too much. Protection, anti-xray or claim plugins that loop over every block in a region, every tick or every join.
- Garbage collection pauses. A long stop-the-world GC pause stalls the tick without any plugin being on the stack.
/spark gcand/spark healthshow pause times; the usual fixes are enough heap, G1 with sensible flags (Aikar's flags are the common starting point), and not allocating the heap to the edge of the machine's RAM.
Folia and Velocity caveats
Folia splits the world into regions ticked on separate threads. There is no single main thread and no global tick, so "which plugin lagged the server" becomes "which region is slow". Use spark with --thread * and Folia's region TPS rather than a single MSPT number.
Velocity is a proxy. It has no game tick, so it never has TPS lag. If players on a network report lag, check the backend they're on. Proxy-side problems show up as slow connects, backend kicks or ping, not MSPT.
Catch lag spikes automatically with ServerStats
spark is excellent when you're at the console while the lag happens. Most lag doesn't wait for you. The ServerStats Minecraft agent has its own always-on sampling profiler for Paper and Purpur, built because spark's API has no per-plugin timing.
How it works (from the agent's documentation):
- The main thread only marks the start and end of each tick. A separate profiler thread sleeps until a tick passes the 50 ms budget, then reads the main thread's stack every 5 ms until the tick ends.
- Each sample is charged to the innermost plugin on the stack, identified by its class loader. If no plugin is on the stack, the sample goes to a server area such as
server:entities,server:chunks,server:block_entities,server:redstoneorserver:worldgen. - When a tick ends over 100 ms (
lag-spike-ms, configurable), the agent sends a lag spike with the worst tick time, the top three causes and their shares, the hottest method (for exampleChunkScanner.scan), players online and total entities. At most one is sent per minute; spikes in between are merged into it. - Every 5 minutes it also sends a profile of ordinary tick time, so you can see which plugins cost the most even when nothing is spiking.
On the agent's test server, a 300–400 ms spike injected inside a test plugin was reported with that plugin as the top cause at a 97–100% share, naming the exact method. The profiler times its own stack reads and throttles itself if it ever stalls the main thread for more than 0.5% of wall time; measured, it was 0.025%.
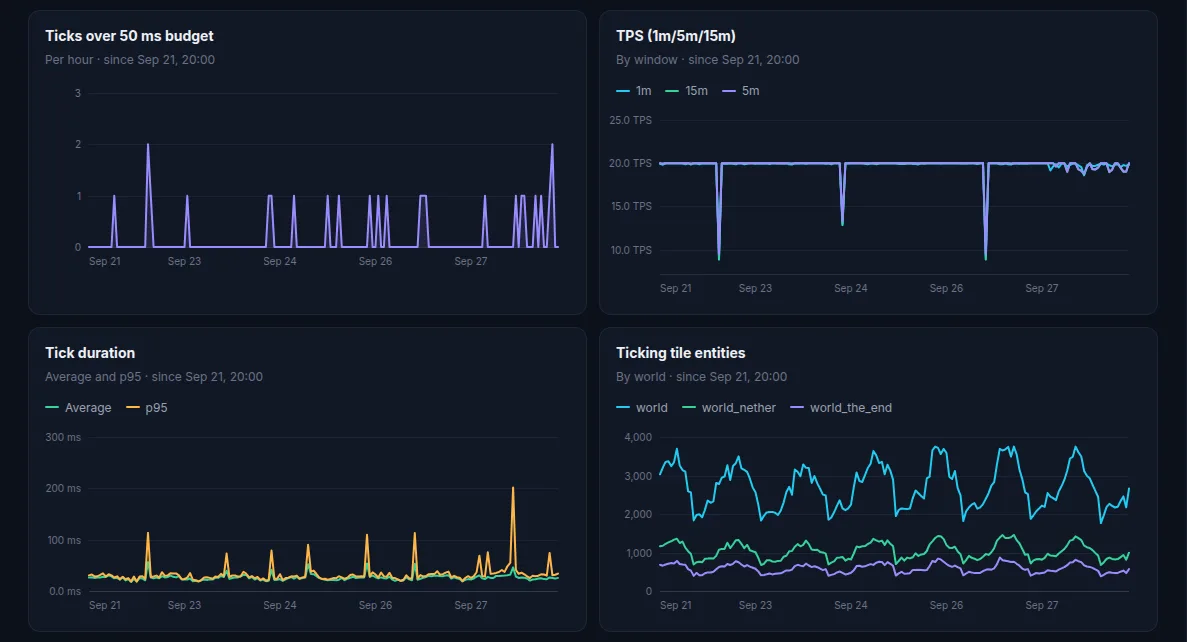
Alongside the spikes, the dashboard charts TPS, MSPT and a tick-time histogram, GC collections and time, heap, loaded chunks, entities and tile entities per world, so you can line up a spike with what changed. You can send a lag spike alert to Discord on every plan, including Free.
Limits worth knowing:
- The profiler is off on Folia (no single main thread); Folia servers get per-region TPS instead.
- The Velocity plugin sends proxy data (players per backend, backend up/down, transfers, kicks). Tick stats and lag attribution come from the Paper agent on each backend server.
- Blame goes to the innermost plugin on the stack. If plugin A calls a slow API in plugin B, B gets the blame, which is usually what you want.
Install takes a few minutes: see installing on Paper and Velocity. The Free plan covers one server with 24 hours of history.
A quick lag-hunting checklist
- Check
/msptmax, not just/tps. If max is over 50 ms and average is low, you have spikes, not a slow server. - Check player ping. If MSPT is fine and players still complain, it's the network.
- Run
/spark profiler start --only-ticks-over 100 --timeout 600during peak hours and read the Server thread. - Plugin at the top? Look at its config for sync saving, database options or scan intervals, then update or replace it.
- Server code at the top? Count entities, look for hopper chains, pre-generate chunks, check
/spark gc. - Keep something recording between checks, so the next spike arrives with a cause attached.
 Minecraft